Rich Pictures - Powerful communication tools to engage your audience and inspire action
Pictures evoke emotions, convey complex ideas, tell stories and connect in ways that words alone cannot. And when that picture is built with the people who know the subject best, something even more powerful happens.
What is a Rich Picture?
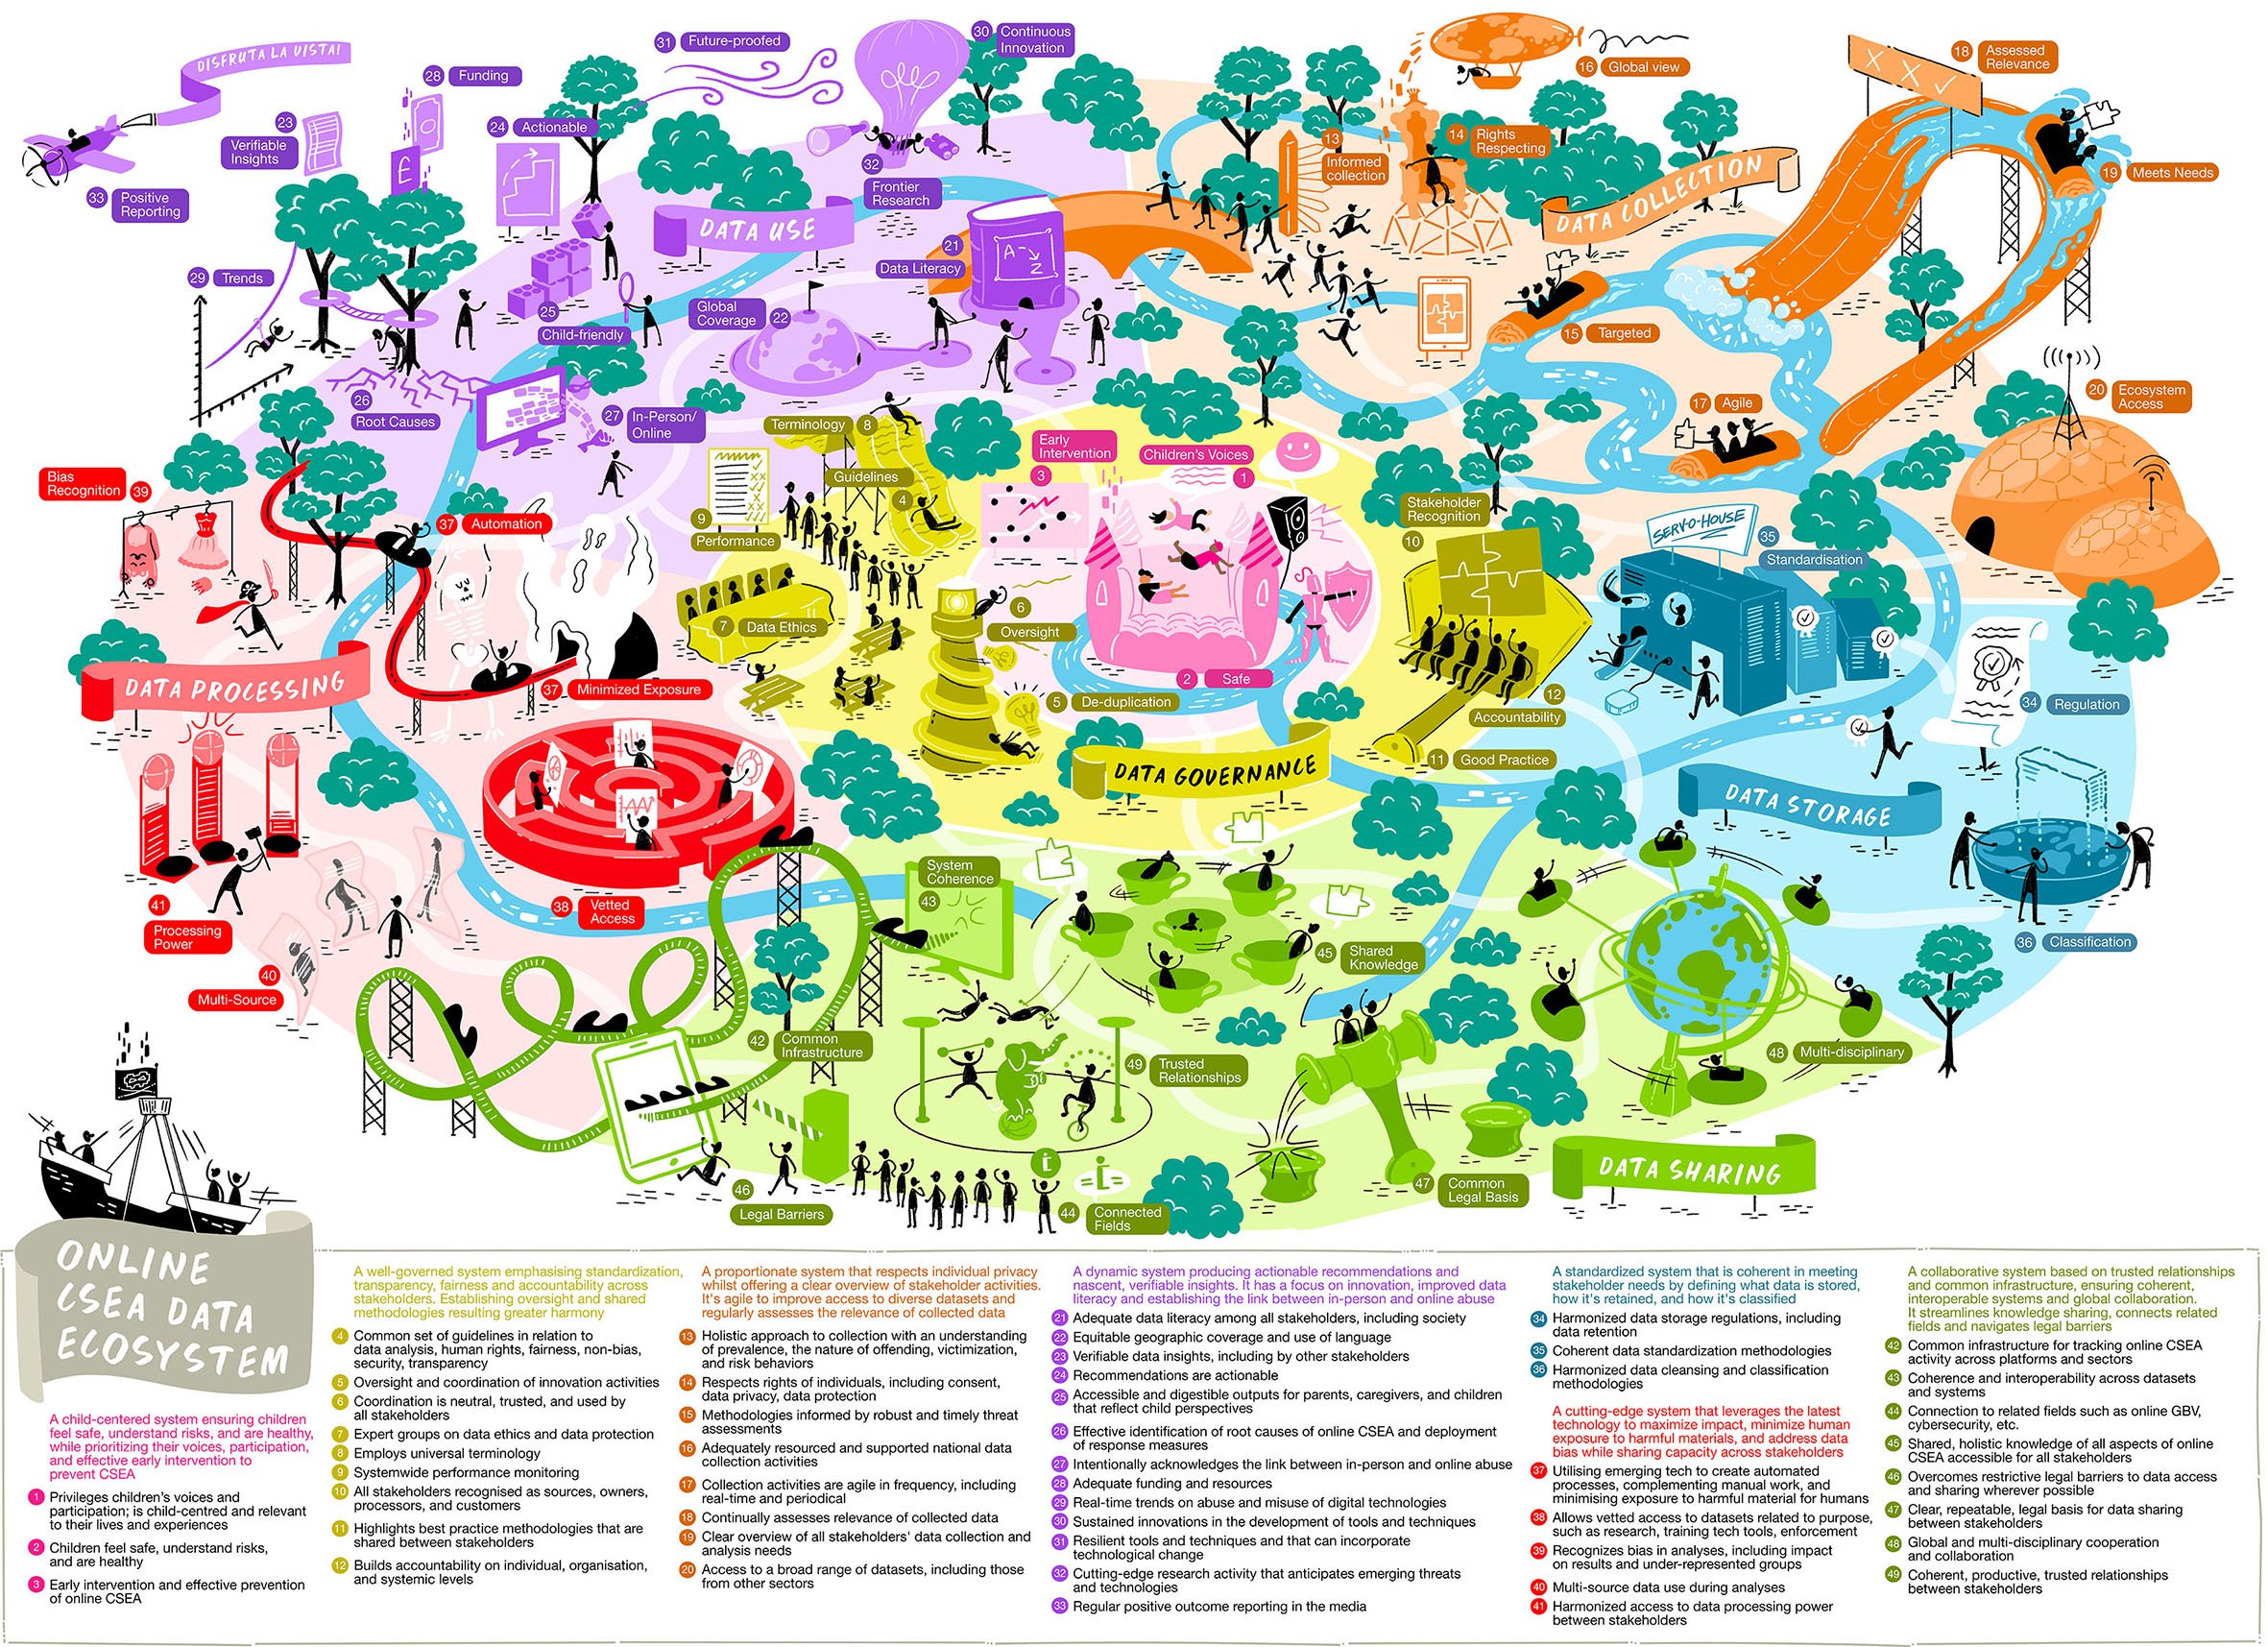
A Rich Picture is a large-format, hand-crafted visual that captures the full complexity of a system, strategy, or story - and makes it instantly understandable. Not just a diagram. Not just an infographic. A living, breathing picture that holds everything in one place: the thinking, the nuance, the narrative.
At Burograph, we create Rich Pictures collaboratively. We work with your team, your strategists, your subject matter experts, your communicators - and we bring your world to life.

The process
A Rich Picture project starts with a Visual Thinking session. We come to you, we ask a lot of questions, and we listen carefully. Our Visual Thinkers begin capturing ideas as the conversation unfolds. By the end of the session, the foundations of your picture are already taking shape.


Why collaboration is the point
The most common mistake made is handing information over and waiting for a visual to come back. That might produce something pretty. But it does it produce something useful.
When we work with you directly, something different happens. The people in the room start to align. Assumptions get challenged. Gaps in thinking get spotted. By the time the Rich Picture is drafted, your team doesn't just have a Visual Storytelling structure - they have shared ownership of the story it tells.
That's the real value. The picture itself is the tool you use to communicate the story.


What do people use Rich Pictures for?
Strategic Vision: You're setting direction for the next three to five years. People need to understand where you're going and feel motivated to get there. A Rich Picture turns a strategy document into something people actually want to look at, talk about, and rally behind.
Bids & Pitches: You're competing for a major contract or new client. The panel has read ten proposals. Yours has a Rich Picture. The conversation starts differently, it gives your story somewhere to live, and gives your audience something that brings it to life.
Roadmaps: You know where you're going, but your teams need to understand the journey, not just the destination. A Rich Picture captures the why behind your roadmap alongside the how, so everyone moves with purpose.
From there, we refine, iterate, and deliver, in formats you can use. Digital, print, interactive, animated. At the scale you need, from an A3 handout to a 10-metre mural.If you've ever thought "we need something that explains all of this in one go" - a Rich Picture is the answer.